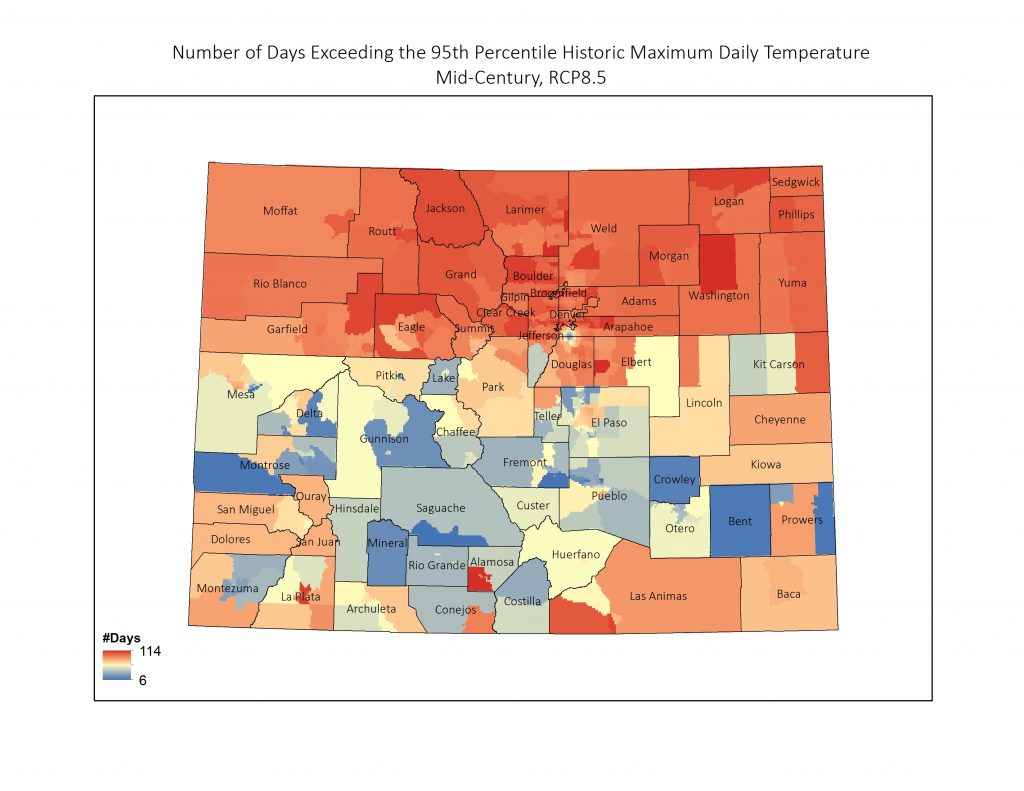
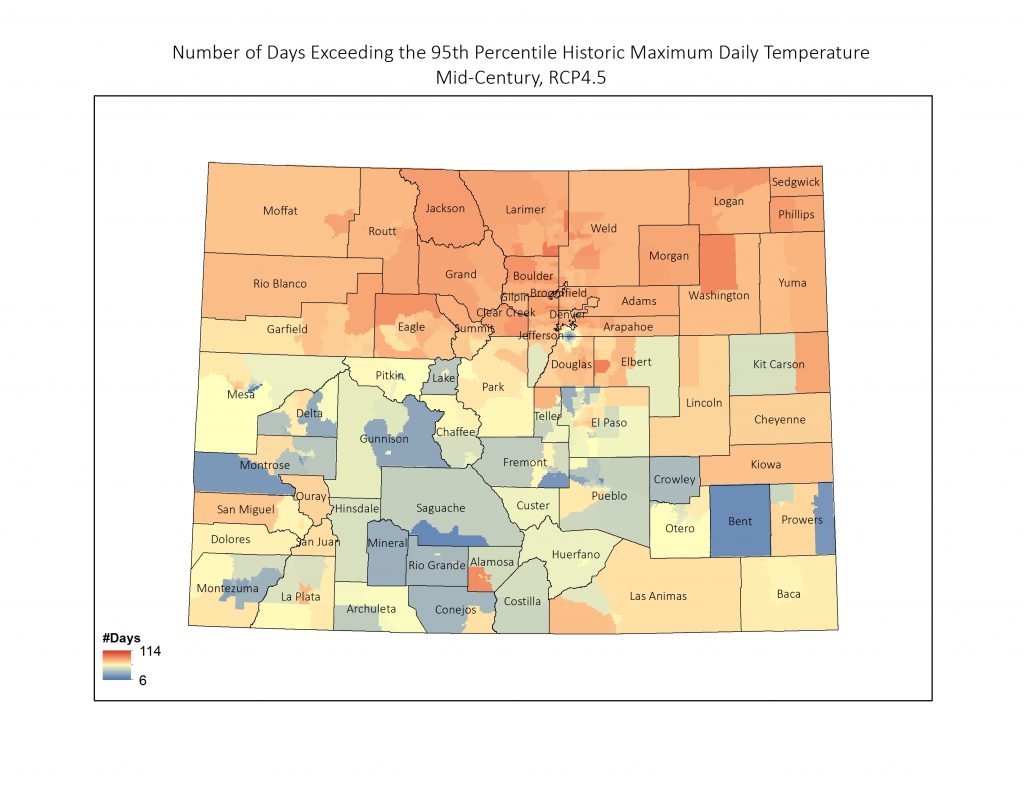
These maps show how pollution from burning fossil fuels (greenhouse gas emissions) is affecting our climate and communities, and the power we have to curb the worst of climate change by taking action to reduce it.
Slide the map to see emissions scenarios for the projected number of days temperatures will exceed the historic 95th percentile by mid-century. One map shows the number of days for a business-as-usual scenario, and the other shows how reducing emissions can help. The darker colors indicate a higher number of days exceeding historic maximum temperatures. Under the moderate emission scenario, Northern Colorado, including the Denver Metro Area, is projected to experience 75 days of extreme heat on average, while under the high emission scenario, the average number of extreme heat days in the same region is projected to be 100 days.
To learn about solutions and actions you can take on these issues visit our Impacts and Solutions.
 HIGH
HIGH
 MODERATE