These maps show how pollution from burning fossil fuels (greenhouse gas emissions) is affecting our climate and communities, and the power we have to curb the worst of climate change by taking action to reduce it.
Slide the map to see two different emissions scenarios for the projected number of decreased ski days lost due to drought. One shows what could happen with business-as-usual (high emissions), and the other shows what educing emissions (moderate emissions) will do. The larger dots indicate a higher risk for fewer ski days.
To learn about solutions and actions you can take on these issues visit Impacts and Solutions.
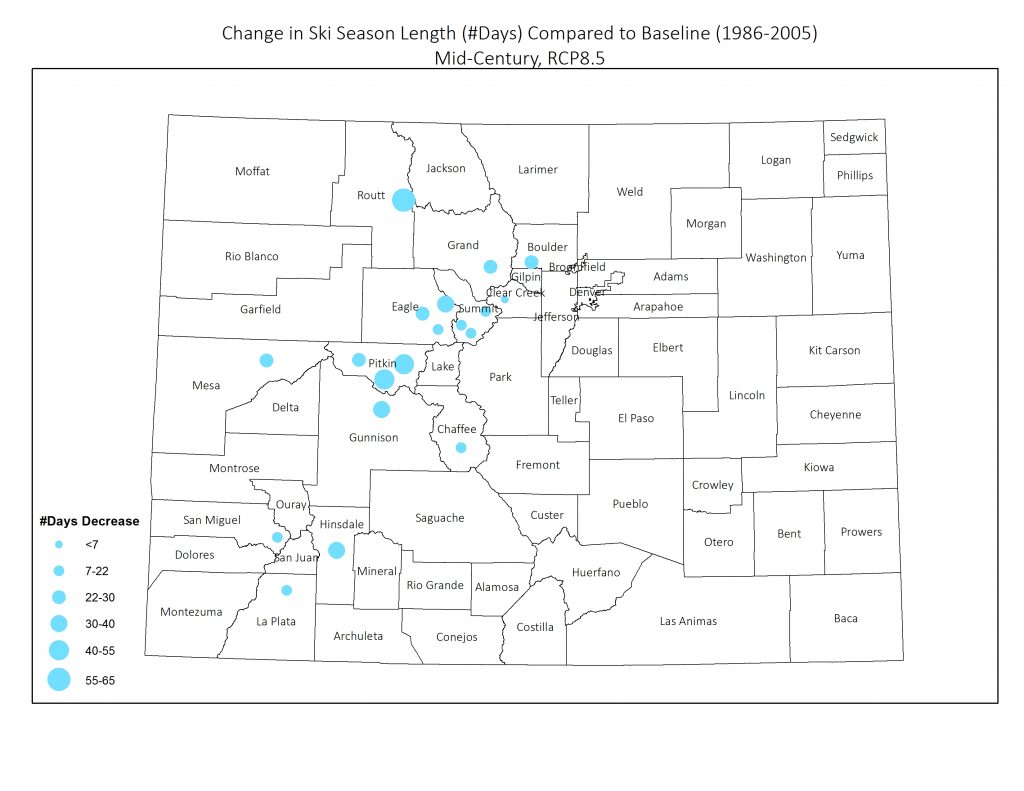 HIGH
HIGH
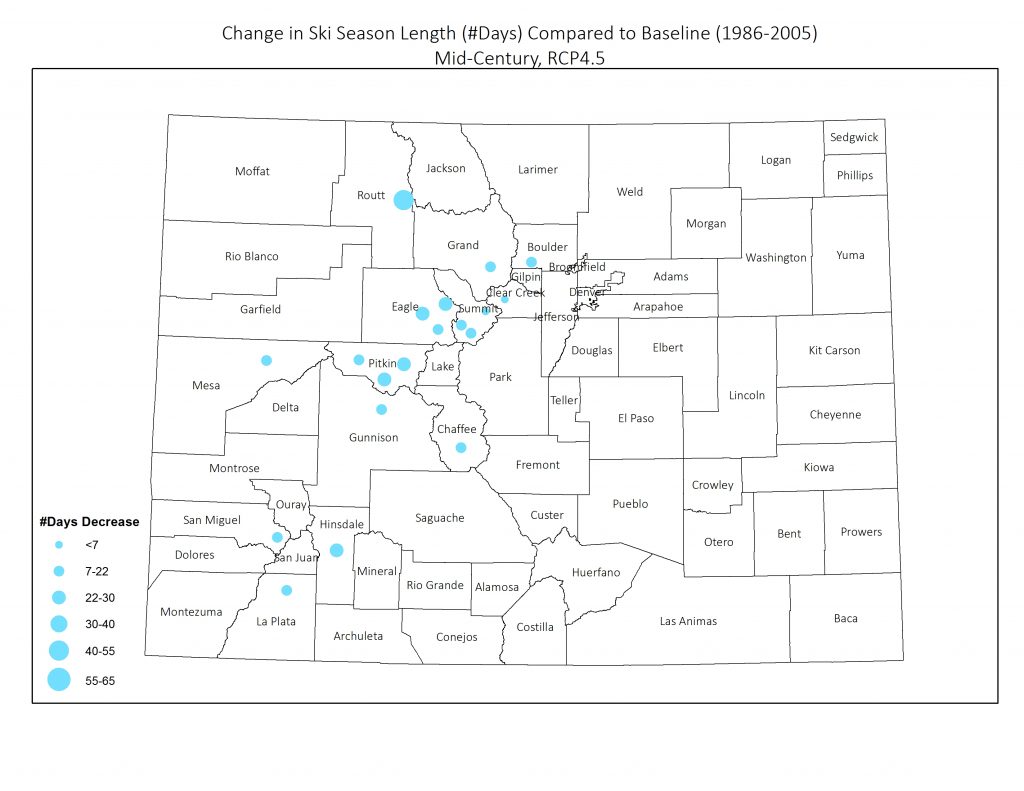 MODERATE